From Suri Duddella
article, first I read about the Market Structures concept. Then I read
more about market structures work from Dr. Ron Lockhart
article .
There are many articles available where you can learn about it .This
concept is very powerful structuring concept ,
but it also very simple to predict. We traders always try to follow some
pattern, momentum, oscillator or some Zen-type signals from different forex
guru. But traders cannot able cue all signals because of market
structures .Prices
start with a wave and it ends at some point and then there is a down-wave, and
it ends some time and then begins another up-wave. You can predict this wave
easily by understanding market structures. Market Structure Low (MSL)
and Market Structure High (MSH)
formation is continuous and is repetitive at every wave begin and at every wave
end. Market
Structures form in all markets, in all time-frames and in all
instruments .
This market structure pattern sometimes fail and again re-fail, then form again
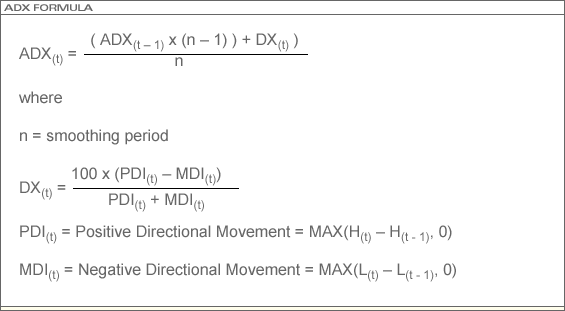
and re-form. This is a concept pattern. Different indicators like Average directional index
, support/resistance levels, are helpful to understand market structure .
This indicator triggers to confirm the theory and it always works .
Different pattern like 3LPB pattern helps you understand forex
market structures.
Market Structure Low (MSL)
.Market
Structure low is explained with three candle pattern such as- A new low
formation, lower low formation, higher low of close formation .
Market structure low is based on close values .
This structure not depend on lows or highs (Please always remember this when
trading market structures). Market structure low based on long triggered
price range .
When prices close above the highest close value price. Stop loss is being place
below the low of the MSL
to protect the trade.
Market Structure High (MSH)
When market structure high pattern form then market shows major tops. They form near key resistance areas or key moving average areas. There are three ways to find patterns. One is to find a series of past market structure highs and build a trend line for resistance. Another way is to find a critical resistance area and trade a short position. Final way is to trade msh is to know a fractal wave form and build a larger wave structure using the distances between them.Trade and Stop loss
Trade is taken when price closes below the low of the third candle .Stop loss should be placed abouve the MSH pattern's high. There are two ways to target MSH shorts. One is to trade until another MSL forms near a key significant level. Trailing stop should be placed in the previous bar's high candle.Trading Market Structure High
The picture shows a simple Market Structure High formation. In this chart, market structure high signal is formed at potential top at 780 level. Short trade opportunity should be taken when price shows below the low of the third candle.
First, Enter a “short” trade below the third candle at 778, then place stop loss above the MSH high at 780.2 . Target is dynamically changed and trade until the prices form either another MSL or if the price closes above the previous bar's high after some profit.
Trading Market Structure Low
Same way, MSL
trades should be taken. These
picture shows an MSL
formation after a long downtrend around 10700 level. This MSL
is confirmed when the price closed about the high of the third candle .
Enter a “long” trade above the high of MSL
at 10850, then ,
at the price 10650 stop order should be placed.


